
The live data from your event-management dashboard allows you to follow how recruiters and candidates are getting on live from the event’s very first day (meaning the day on which the interviews start).
👉 Experience the rush of your event as if you were there in person !
CONTENTS:
ACCESS YOUR REAL-TIME DASHBOARD
As an event organiser you have access to the real-time dashboard, available in your personal space in the Dashboard tab, from the moment the job dating opens until the day it closes:
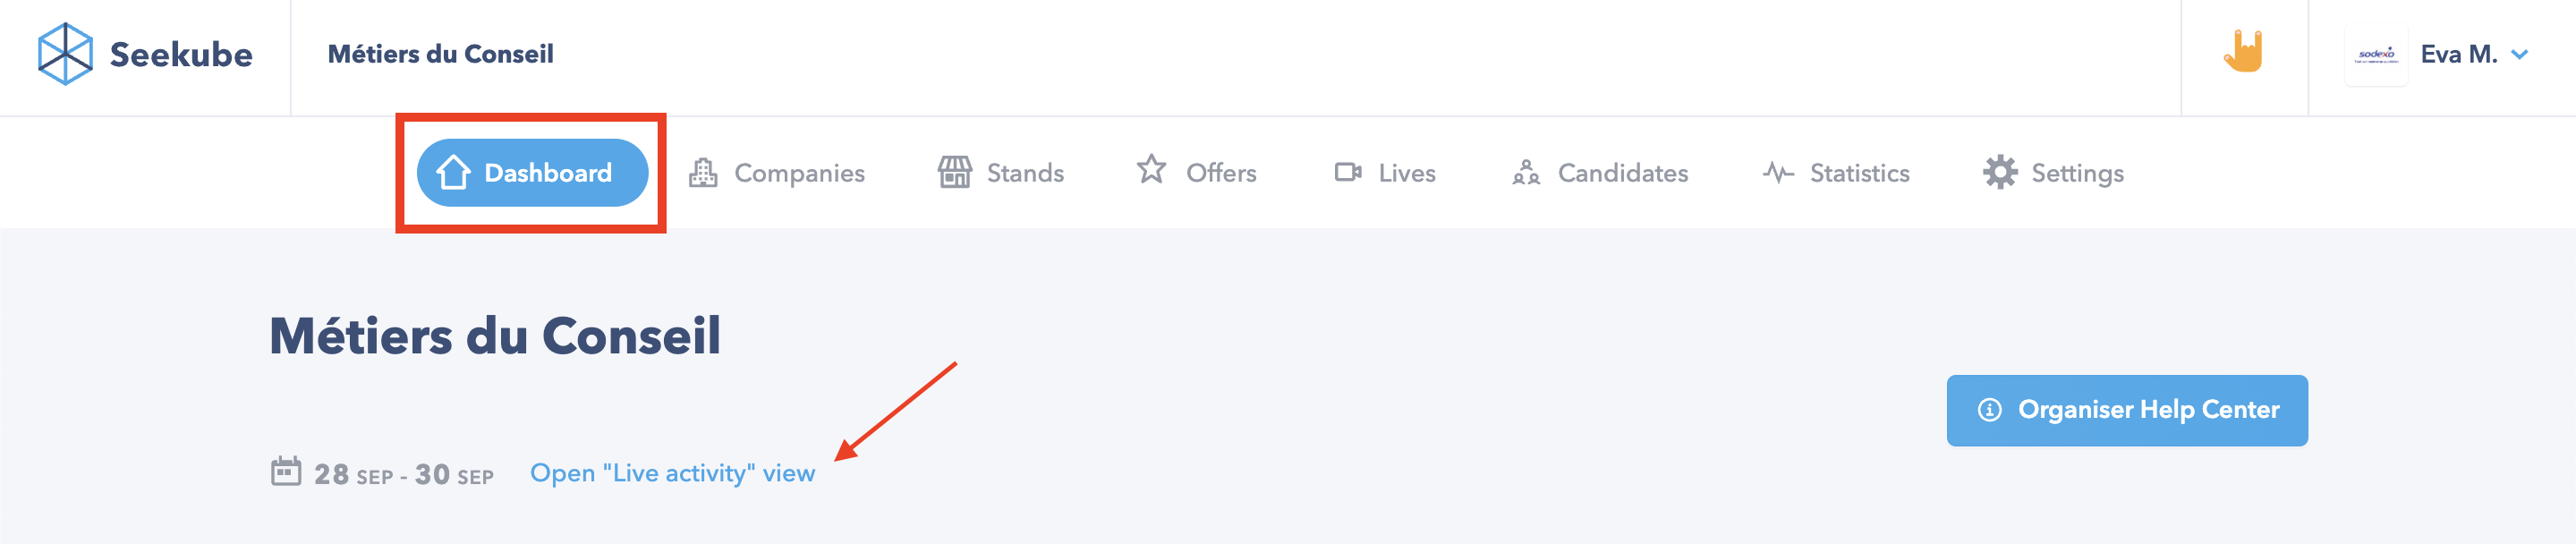
💡 On your event’s starting date (= the date the interviews start), you’ll also receive an email from Seekube containing a link to access it directly.
💡 For hybrid events (on-site + virtual), the real-time dashboard is split into two different tabs : one for the on-site part (displayed by default), and one for the virtual part, which you’ll need to click to bring up. Statistics are displayed in the same way for both modes.
DATA IN REAL-TIME
This dashboard lets you monitor various key figures linked to your event’s activity:
- Number of recruiters and candidates online
This refers to the active candidates and recruiters taking part in the event. Either they have viewed one of the event’s pages in the last five minutes, OR they are currently in an appointment :
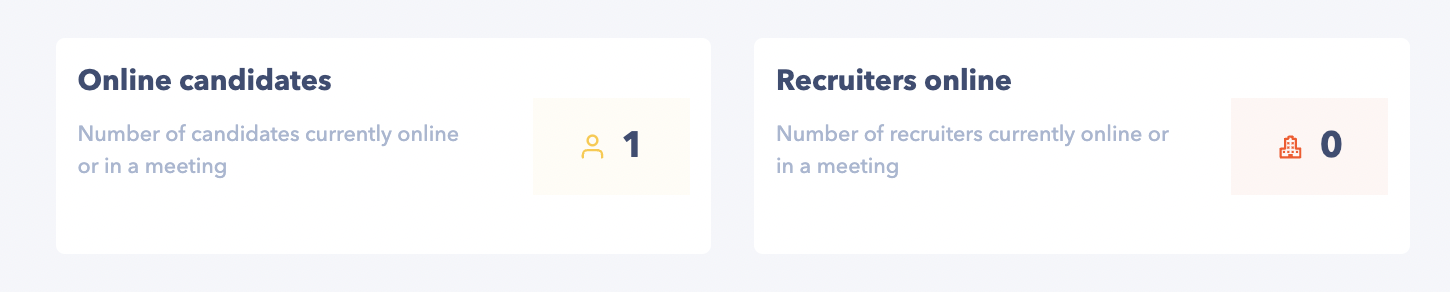
💡 These figures are updated every 10 seconds
- Number of appointments held so far
This refers to the number of appointments that have already taken place over the course of your event. An appointment is counted as already having taken place from the end of its given time slot:
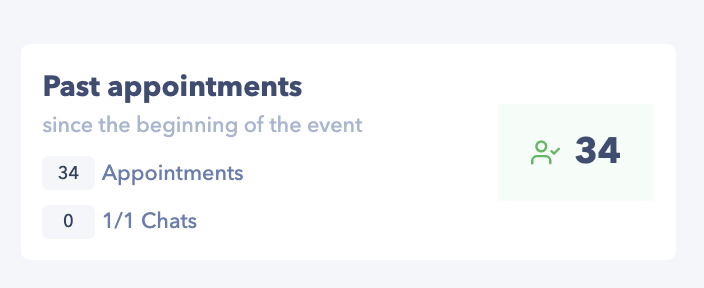
💡 This figure is updated every 15 minutes
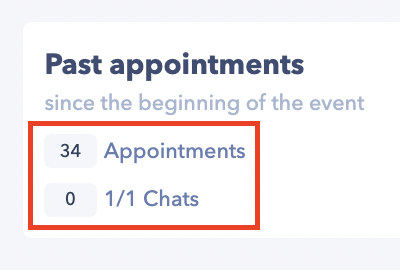
If 1-to-1 Chats are enabled for your event, you’ll be able to view a breakdown of all appointments based on how they are held:
- Appointments for the day
The ‘appointments for the day’ table lets you track your event’s appointments in real time.
At the top of the table, you’ll see the number of scheduled appointments for the day, and whether they are being held by webcam, phone, or in-person (if your event is hybrid):

You can also see the number of appointments scheduled as interviews and 1-to-1 Chats (if 1-to-1 Chats are enabled for your event).
💡 The “Export all appointments” button lets you export your data as an .xls file.
The lower section of the table contains the details for each appointment:
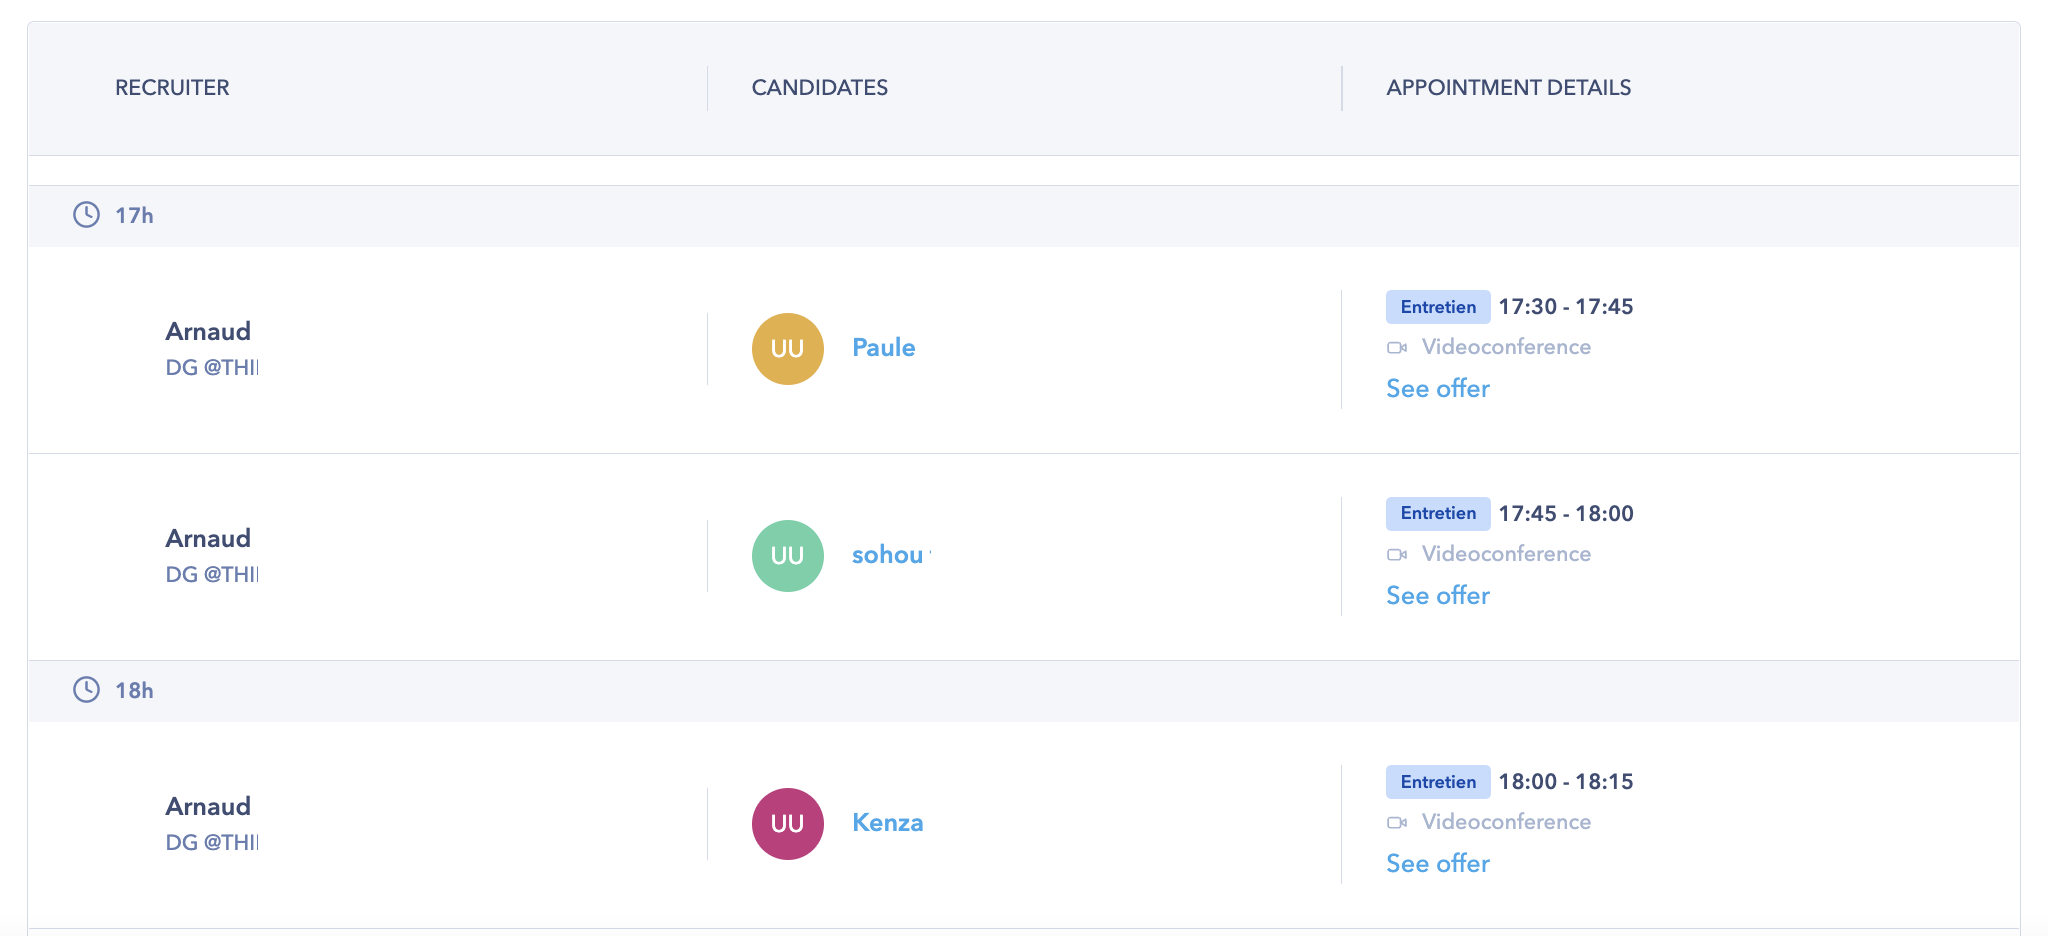
- The name of the person leading the interview (name, job title, company)
- The name of the candidate (clicking on their name brings up their profile)
- The appointment details (time, type of slot, interview mode)
- A link to the job offer connected to the interview time slots (this link doesn’t appear in 1-to-1 Chat slots as these aren’t linked to specific job offers)
💡 If an appointment is cancelled, the details are replaced with a line specifying who cancelled it.
- Live sessions for the day (only if live sessions are enabled for your event)
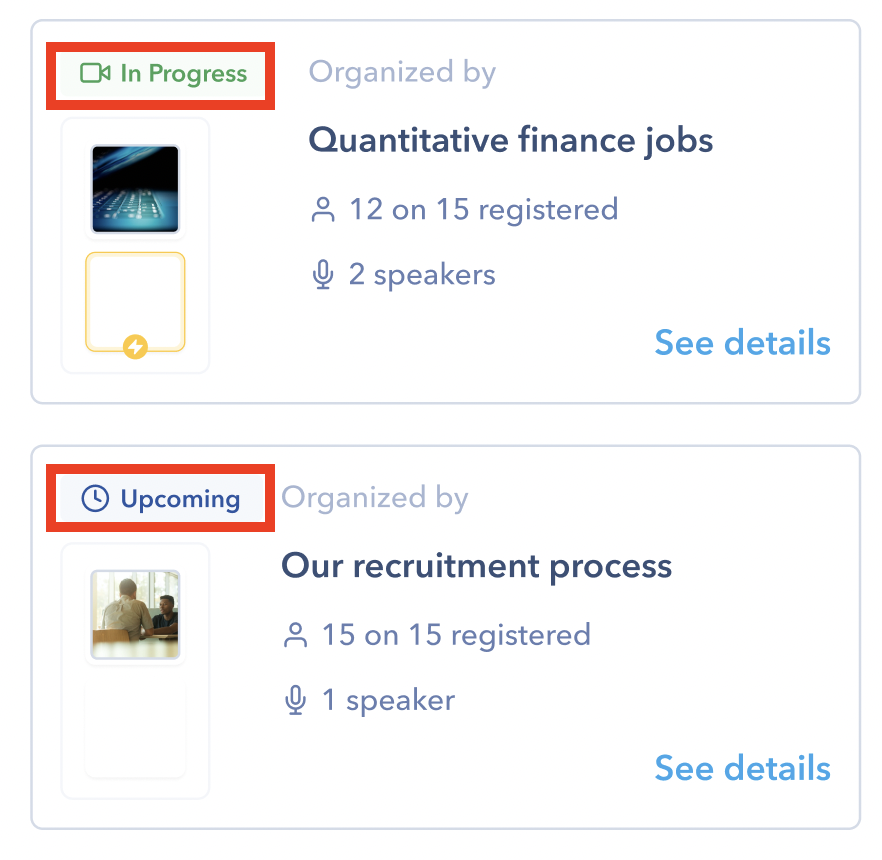
In this space, you’ll find a recap of all the day’s live sessions, whether finished, in progress, or upcoming. The label in the top left corner of each live session’s box contains information on its status :
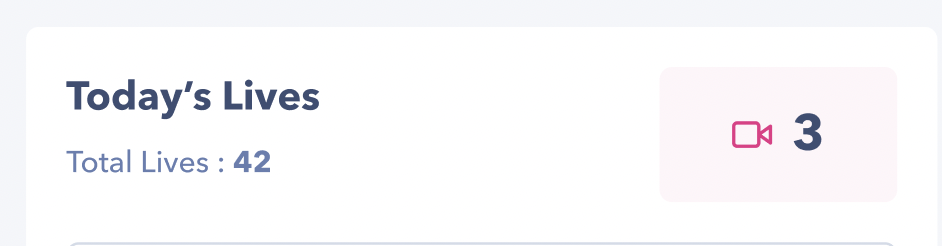
In the top left is the total number of live sessions posted for the event, and on the right in pink is the number of live sessions for the day :
Each live session’s box also contains information on :
- The start time and date, as well as its run time
- The number of registered participants out of the number of available spots
- The number of speakers
💡 Click on “See details" to pull up a description of the live session and the list of participants. Click here to find out more.
💡 If needed, the “Access the live session” button in the conference’s box lets you log in to take part, follow, and support the speakers.
🎉 You now know how to use and navigate your real-time dashboard !